Create a chart using JFreeChart and incorporate it into a PDF document
This is an example of an utility app useful to automate the generation of graphs and PDFs containing graphs. One use case could be a stock market research platform that does Technical Analysis on stock prices, detects patterns and generates PDF reports automatically.
To start, create a new Java project or open an existing one, then add JFreeChart https://github.com/jfree/jfreechart and PDFBox https://pdfbox.apache.org/ dependencies in pom.xml:
xml<dependencies>
   ...
    <dependency>
      <groupId>org.jfree</groupId>
      <artifactId>jfreechart</artifactId>
      <version>1.5.3</version>
    </dependency>
    <dependency>
      <groupId>org.apache.pdfbox</groupId>
      <artifactId>pdfbox</artifactId>
      <version>2.0.27</version>
    </dependency>
    ...
</dependencies>
Create a new package com.pdf.pdf_charts and add a dummy time series data generator:
javapackage com.pdf.pdf_charts;

import org.jfree.data.general.SeriesException;
import org.jfree.data.time.Day;
import org.jfree.data.time.TimeSeries;

import java.time.LocalDateTime;
import java.time.temporal.ChronoUnit;

public class DummyDataGenerator {

    public static TimeSeries generate(String name, int nrOfElements, double startValue) {
        final TimeSeries series = new TimeSeries( name );
        LocalDateTime dtl = LocalDateTime.now();
        double value = startValue;

        for (int i = 0; i < nrOfElements; i++) {
            var ld = dtl.minus(nrOfElements - i, ChronoUnit.DAYS);
            var current = new Day(ld.getDayOfMonth(), ld.getMonthValue(), ld.getYear());

            try {
                value = value + Math.random( ) - 0.5;
                series.add( current , Double.valueOf(value) );
            } catch ( SeriesException e ) {
                System.err.println( "Error adding to series" );
            }
        }
        return series;
    }
}
How to generate a chart with JFreeChart
Create a class named ChartGenerator in com.pdf.pdf_charts.
The function fromTimeSeries creates and returns a Chart from an array of timeSeries, with a title, X/Y axes labels and an array of chart lines colors corresponding to each time series. Grid lines strokes and colors, background colors etc. are all customizable. You can also save the chart as jpg with saveAsJPG by specifying the output file path and the picture's dimensions.
javapackage com.pdf.pdf_charts;

import org.jfree.chart.ChartFactory;
import org.jfree.chart.ChartUtils;
import org.jfree.chart.JFreeChart;
import org.jfree.chart.plot.XYPlot;
import org.jfree.chart.renderer.AbstractRenderer;
import org.jfree.chart.renderer.xy.XYItemRenderer;
import org.jfree.data.time.TimeSeries;
import org.jfree.data.time.TimeSeriesCollection;
import org.jfree.data.xy.XYDataset;

import java.awt.*;
import java.io.File;
import java.io.IOException;

public class ChartGenerator {

    public static JFreeChart fromTimeSeries(TimeSeries[] timeSeries, String title, String XLabel, String YLabel, Color[] seriesColors) {
        TimeSeriesCollection tsCollection = new TimeSeriesCollection();
        for (int i = 0; i < timeSeries.length; i++) {
            tsCollection.addSeries(timeSeries[i]);
        }

        final XYDataset dataset = (XYDataset) tsCollection;
        JFreeChart timeChart = ChartFactory.createTimeSeriesChart(
                title,
                XLabel,
                YLabel,
                dataset,
                true,
                false,
                false);


        // customize colors etc.
        XYPlot plot = timeChart.getXYPlot();
        plot.setBackgroundPaint(Color.decode("#F1F0EA"));

        plot.setRangeGridlinesVisible(true);
        plot.setRangeGridlinePaint(Color.black);
        plot.setRangeGridlineStroke(new BasicStroke(0.1f));
        plot.setDomainGridlinesVisible(true);
        plot.setDomainGridlinePaint(Color.BLACK);
        plot.setDomainGridlineStroke(new BasicStroke(0.1f));

        plot.setDomainZeroBaselineVisible(false);
        plot.setOutlineVisible(false);
        plot.setRangeZeroBaselineVisible(false);
        plot.setDomainCrosshairVisible(false);

        XYItemRenderer renderer = plot.getRenderer();
        // each time series can have a different color
        for (int i = 0; i < timeSeries.length; i++) {
            renderer.setSeriesPaint(i, seriesColors[i]);
        }
        renderer.setDefaultStroke(new BasicStroke(1.0f));
        renderer.setDefaultOutlineStroke(new BasicStroke(0.5f));
        ((AbstractRenderer) renderer).setAutoPopulateSeriesStroke(false);

        return timeChart;
    }

    public static void saveAsJPG(JFreeChart chart, String filePath, int width, int height) {
        File timeChart = new File(filePath);
        try {
            ChartUtils.saveChartAsJPEG(timeChart, chart, width, height);
        } catch (IOException e) {
            throw new RuntimeException(e);
        }
    }
}
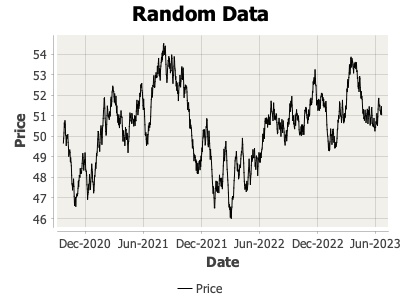
Example of a generated graph:
Generate the PDF containing a chart
Create a class PDFWithChart in the package com.pdf.pdf_charts.
The function generatePDF takes as input the chart data and a path as String (where to save the pdf). It embeds the chart into the document at some coordinates .drawImage(pdfChartImage, 20, 300); and inserts a title.
javapackage com.pdf.pdf_charts;

import org.apache.pdfbox.pdmodel.PDDocument;
import org.apache.pdfbox.pdmodel.PDPage;
import org.apache.pdfbox.pdmodel.PDPageContentStream;
import org.apache.pdfbox.pdmodel.font.PDType1Font;
import org.apache.pdfbox.pdmodel.graphics.image.JPEGFactory;
import org.apache.pdfbox.pdmodel.graphics.image.PDImageXObject;
import org.jfree.chart.JFreeChart;
import org.jfree.data.time.TimeSeries;

import java.awt.*;
import java.awt.image.BufferedImage;

public class PDFWithChart {

    public static void generatePDF(String filePath, JFreeChart chart) {
        try {
            PDDocument document = new PDDocument();
            PDPage page = new PDPage();
            document.addPage(page);
            PDPageContentStream content = new PDPageContentStream(document, page);

            // add graph
            BufferedImage chartImage = chart.createBufferedImage(500, 400);
            PDImageXObject pdfChartImage = JPEGFactory.createFromImage(document, chartImage, 1f);
            content.drawImage(pdfChartImage, 20, 300);

            // Doc. Title
            content.beginText();
            content.setFont(PDType1Font.TIMES_BOLD, 24);
            content.newLineAtOffset(50, 750);
            content.showText("Random Data Graph");
            content.endText();

            // save
            content.close();
            document.save(filePath);
            document.close();
        } catch (Exception e) {
            System.out.println(e);
        }
    }
}
To try it, let's add a main function that generates a dummy data time series, creates the chart and saves it as JPG, then embeds it into the PDF:
javapublic static void main(String[] args) { // generate dummy data stream TimeSeries dummyData = DummyDataGenerator.generate("Price", 1000, 50); TimeSeries[] series = {dummyData}; Color[] colors = {Color.decode("#000000")}; // generate chart var chartData = ChartGenerator.fromTimeSeries(series, "Random Data", "Date", "Price", colors); // save as jpg ChartGenerator.saveAsJPG(chartData, "chart.jpg", 400, 300); // generate pdf generatePDF("chart.pdf", chartData); }
Full source code is here;